
Measure to understand
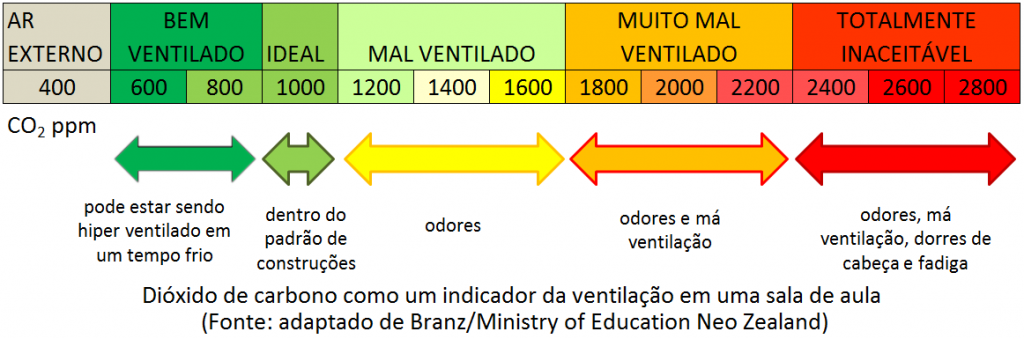
According to a study conducted for the New Zealand Ministry of Education on Indoor Air Quality and Ventilation conditions in schools [1] , concentrations above 1000 parts per million (ppm) CO 2 indicate that indoor air quality is unacceptable. The figure below shows the levels of carbon dioxide used by the study as reference for ventilation and consequent CO 2 concentration inside buildings.
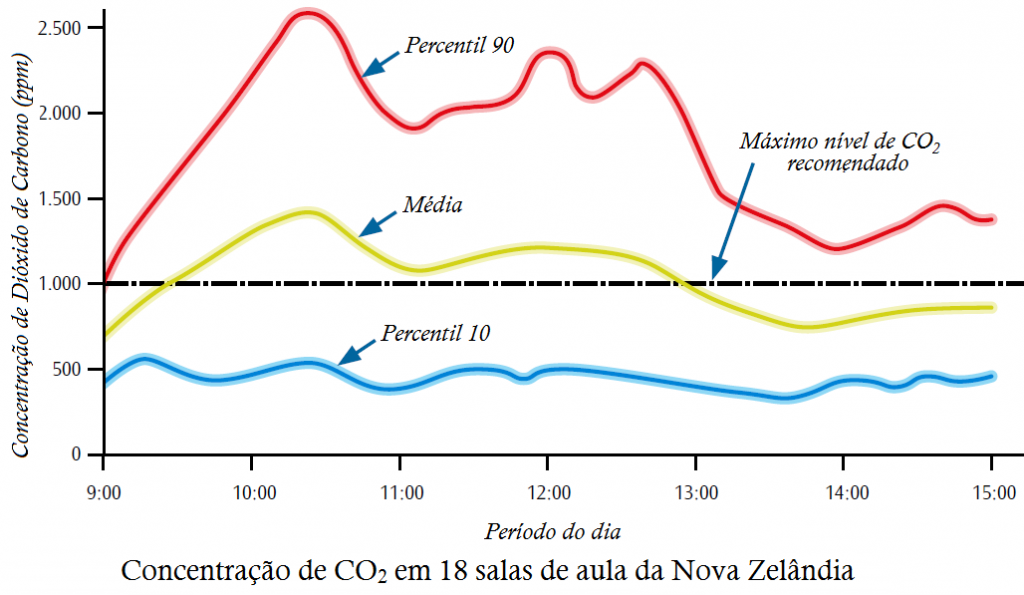
In the mentioned study, the levels rose steadily until temperatures reached about 20 ° C, as the windows were opened the CO 2 levels reduced, as shown below. Measurements were taken at regular intervals throughout the day using sensors and recording devices offline . According to the study, it is necessary to monitor pollutants such as CO 2 and other particles, which can affect both students health and the performance, and currently there is a lack of solutions to perform such monitoring.
Unhealthy air affects health and performance
There was a significant increase of scientific studies correlating indoor air quality with quality of life, mainly from the years 2000’s. According to the American Foundation Healthy Schools Network, several studies have found an association between reducing school performance with low ventilation rates or high CO 2 concentrations . Some studies indicate the decrease in yield with temperatures well above 20ºC. Studies point to the association between the reduction of cognitive performance and the increase of external pollutants .
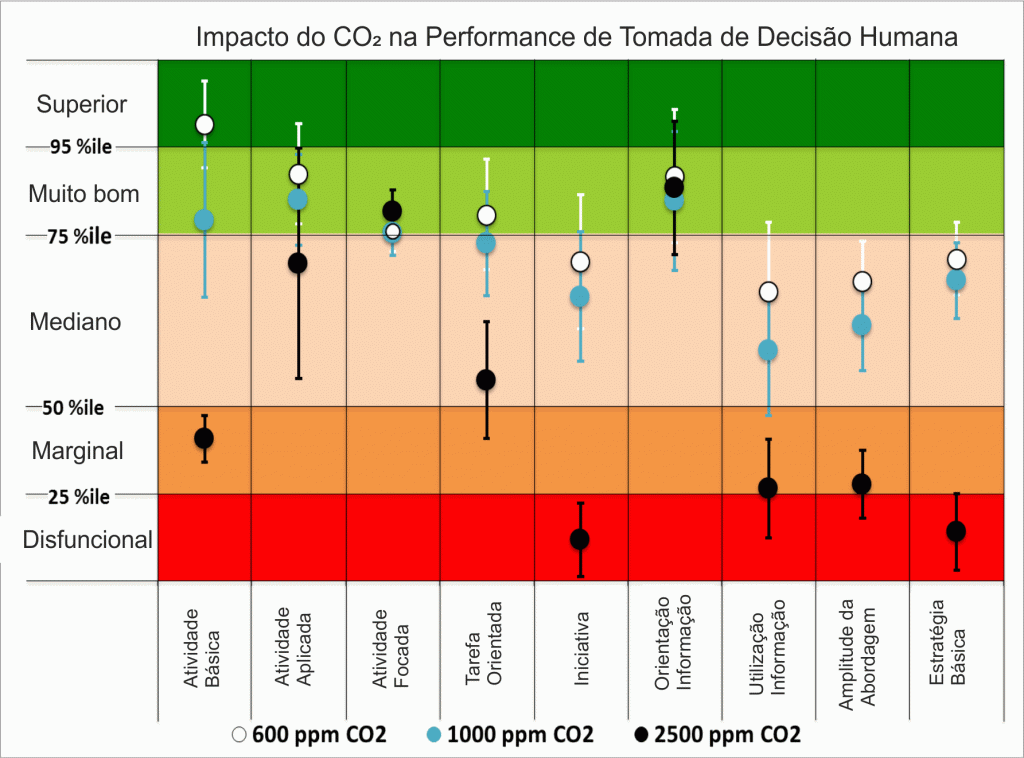
The effect of increasing the ventilation rate, indicated by CO 2 reduction, improves students’ performance , see details of the surveys below.
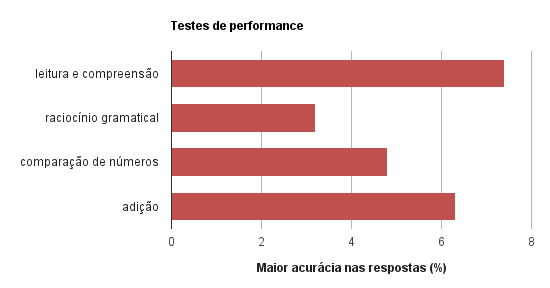
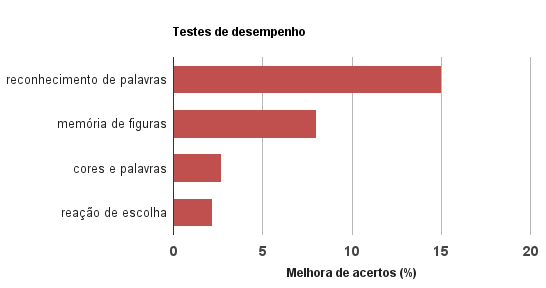
The impact of CO 2 in classrooms, with three different concentration levels, was analysed in regards to the impact on student performance in daily activities, has shown to directly affect decision making.
Ventilation can be a simple solution
Studies in California associated the rate of classroom ventilation with student absences during the school year. The study looked for correlations between the type of buildings, the forms of ventilation and the location of the schools. The study puts in discussion the most traditional way we use in Brazil for ventilation and conditioning of thermal comfort: air conditioning.
Average peak CO 2concentration (ppm) |
Average estimated ventilation rate (l / s / person) |
|
| School / district | ||
| South coast | 1140 | 7.01 |
| Bay area | 1400 | 5.14 |
| Central Valley | 2380 | 2.61 |
| Type of building | ||
| Permanent | 1390 | 5.24 |
| Portable | 2060 | 3.12 |
| Type of ventilation | ||
| Natural | 1270 | 5.95 |
| Mechanics / without Air Conditioning | 1080 | 7.56 |
| Air conditioning | 2280 | 2.75 |
External links:
Designing Quality Learning Spaces: Ventilation & Indoor Air Quality, 2007, Developed by BRANZ Ltd for the Ministry of Education of New Zealand
http://www.who.int/ceh/capacity/Indoor_Air_Pollution.pdf.
http://www.climatechange2013.org/images/report/WG1AR5_SPM_FINAL.pdf.
www.unep.org/yearbook/2014/PDF/chapt7.pdf.
Industrial pollutants – Mohai, Health Affairs 2011.
Traffic related pollutants – Sunyur, Plos Med, 2015.
Petersen, Steffen, et al, “The effect of increased classroom ventilation rate indicated by reduced CO2 concentration on the performance of schoolwork by children.” Indoor air 26.3 (2016): 366-379.
Bakó-Biró, Zs, et al. “Ventilation rates in schools and pupils’ performance.”Building and Environment 48 (2012): 215-223.
Satish, Usha, et al. “Is CO2 an indoor pollutant? Direct effects of low-to-moderate CO2 concentrations on human decision-making performance.”Environmental health perspectives 120.12 (2012): 1671.
Mendell, Mark J., et al. “Association of classroom ventilation with reduced illness absence: a prospective study in California elementary schools.”Indoor air 23.6 (2013): 515-528.